EV Statistics 2025 - UK Home Electric Car Charge Points

Published 10/22/2024
Electric vehicles (EVs ) – love them or loathe them, they’re a staple on the roads of the UK with ownership increasing. And while many motorway charge points have become incredibly expensive for EV owners, home charging is still feasible at a much lower cost per mile than petrol or diesel.
So as of 2025, how many people in the UK own electric cars and how many of those are using a home charging point to charge up?
We take a look at this and other key EV statistics in our round up. Let’s dive in.
The facts
If you’re only here for the headlines, you’ll find the most important figures and statistics below. You can read on for more context, sources and information:
- 1 in 6 people in the UK have an electric vehicle
- A further 1 in 5 plans to get one in the future
- The most searched for EV in the UK (based on Google data) is the Tesla Model Y
What proportion of people in the UK own an EV and how many have home chargers?
In October 2024, we surveyed a demographically representative sample of 2,002 people aged 16 and over in the UK and we asked the following question:
Which of the following statements, if any, most applies to you?
- I have an electric car and a home charger
- I have an electric car but no home charger and do not plan to install one
- I have an electric car but no home charger, but I have plans to install one
- I do not have an electric car, but I plan to get an electric car and will install a home charger
- I do not have an electric car, but I plan to get an electric car and will not install a home charger
- I do not have an electric car, and I have no plans to get an electric car or a home charger
- N/A or none of the above
- Unsure
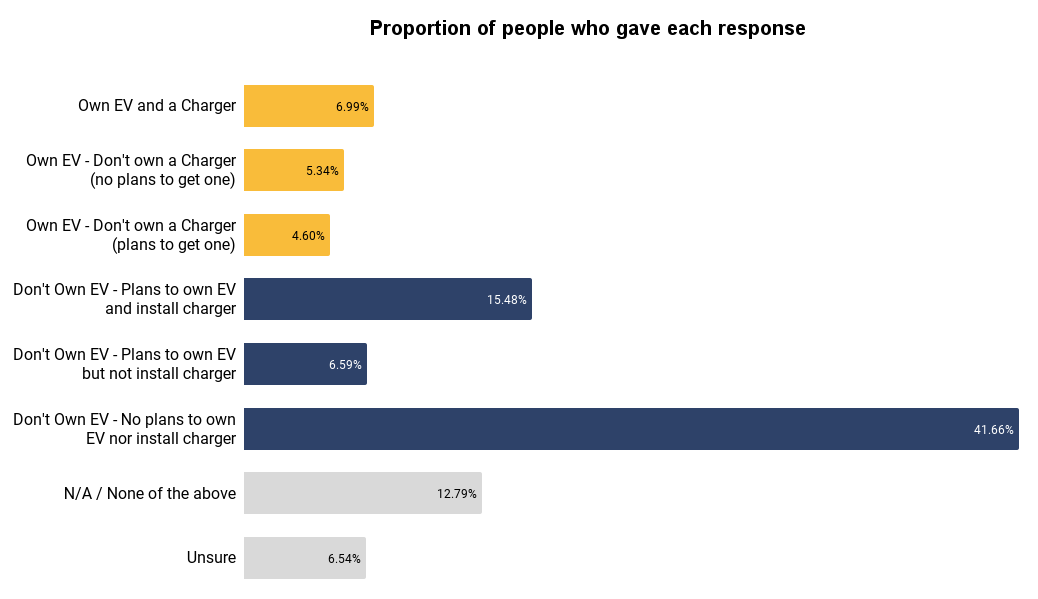
Here are the responses:
| Response | % of people who gave that response |
|---|---|
| I have an electric car and a home charger | 6.99% |
| I have an electric car but no home charger and do not plan to install one | 5.34% |
| I have an electric car but no home charger, but I have plans to install one | 4.60% |
| I do not have an electric car, but I plan to get an electric car and will install a home charger | 15.48% |
| I do not have an electric car, but I plan to get an electric car and will not install a home charger | 6.59% |
| I do not have an electric car, and I have no plans to get an electric car or a home charger | 41.66% |
| N/A or None of the above | 12.79% |
| Unsure | 6.54% |
We learned:
- 16.93% of people aged 16 and over in the UK currently have an EV, in other words, 1 in 6 people in the UK now has an EV
- A further 22% plan to get an EV
- 41% of those with an EV have a home EV charger installed
- A further 27% of EV owners plan to install a charger at home (but don’t have one yet)
- Over half of people who plan to get an EV in the future also intend to install a home charger
EV ownership by gender
EV ownership is 16.93% across the country. But it varies by gender.
| Male | Female | |
|---|---|---|
| Proportion of respondents who currently have an EV | 21.19% | 12.91% |
| Proportion of respondents who do not have an EV but plan to get one | 23.76% | 20.48% |
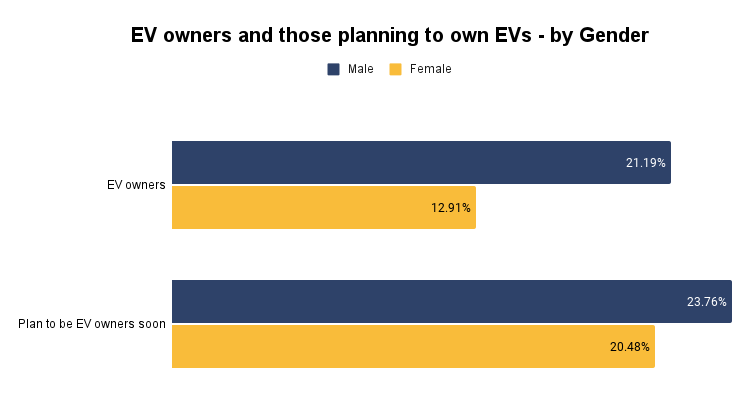
Men are significantly more likely to have an EV than women according to our statistics. In the UK, more than 1 in 5 men say they currently have an EV and a further 24% plan to get one.
With women, the proportion who say they currently have one drops to just 12.91%, while just over 1 in 5 say they plan to get one.
EV ownership by age
We see huge variations by age as well. Of course, some of this could be down to economic factors such as the fact that younger people generally have lower incomes and EVs typically tend to be newer and more expensive up-front vehicles to purchase. This could be affected as well by the fact that you cannot have a driving licence in the UK until the age of 17.
| Age | Proportion of respondents who currently have an EV | Proportion of respondents who do not have an EV but plan to get one |
|---|---|---|
| 16 to 24 | 23.64% | 27.48% |
| 25 to 34 | 29.75% | 29.43% |
| 35 to 44 | 25.08% | 29.11% |
| 45 to 54 | 16.05% | 18.83% |
| 55+ | 5.53% | 15.70% |
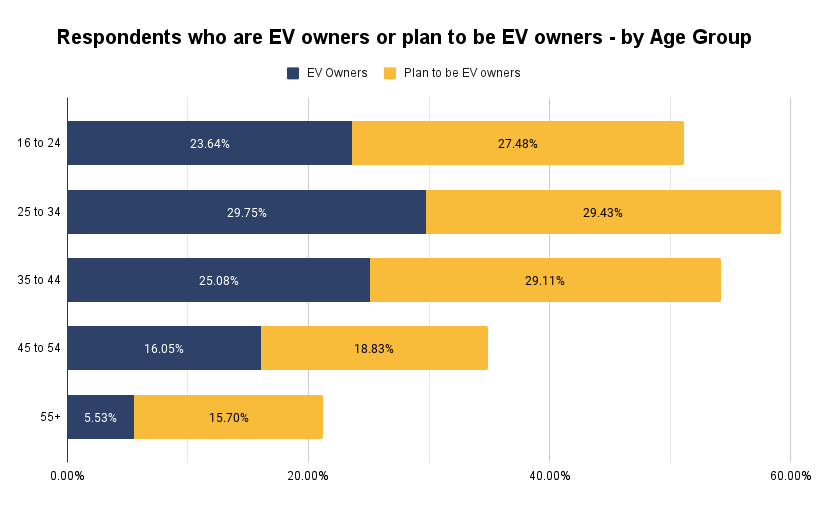
Almost 1 in 3 of those aged 25 to 34 already have an EV and a similar proportion again plan to get one in the future.
At the opposite end of the scale, just 1 in 20 of those aged 55 and over has an EV and just 15% plan to get one in the future.
Amongst the youngest age group – those aged 16 to 35 – 23.64% have an EV already and over a quarter plan to get one.
Engagement with EVs is, as our statistics show, far less likely in the older age groups across the UK.
EV ownership statistics by UK region
We also see some variation region to region. Let’s take a look at the statistics.
| Region | % of respondents who currently have an EV | % of respondents who do not have an EV but plan to get one |
|---|---|---|
| East of England | 14.66% | 27.23% |
| Greater London | 25.48% | 23.58% |
| East Midlands | 16.67% | 20.00% |
| West Midlands | 13.97% | 26.25% |
| North East | 16.05% | 16.05% |
| North West | 22.32% | 21.87% |
| Northern Ireland | 20.00% | 30.91% |
| Scotland | 13.89% | 25.00% |
| South East | 12.54% | 21.15% |
| South West | 12.99% | 14.69% |
| Wales | 13.68% | 21.06% |
| Yorkshire and the Humber | 17.68% | 18.90% |
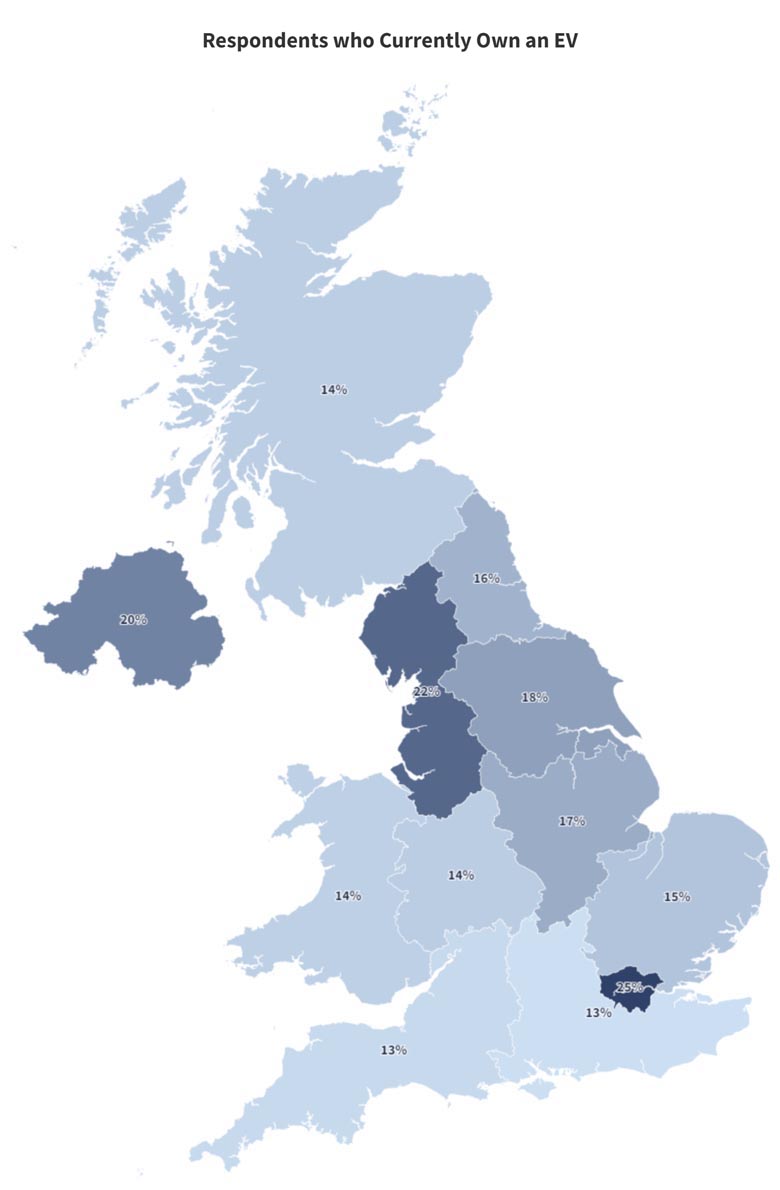
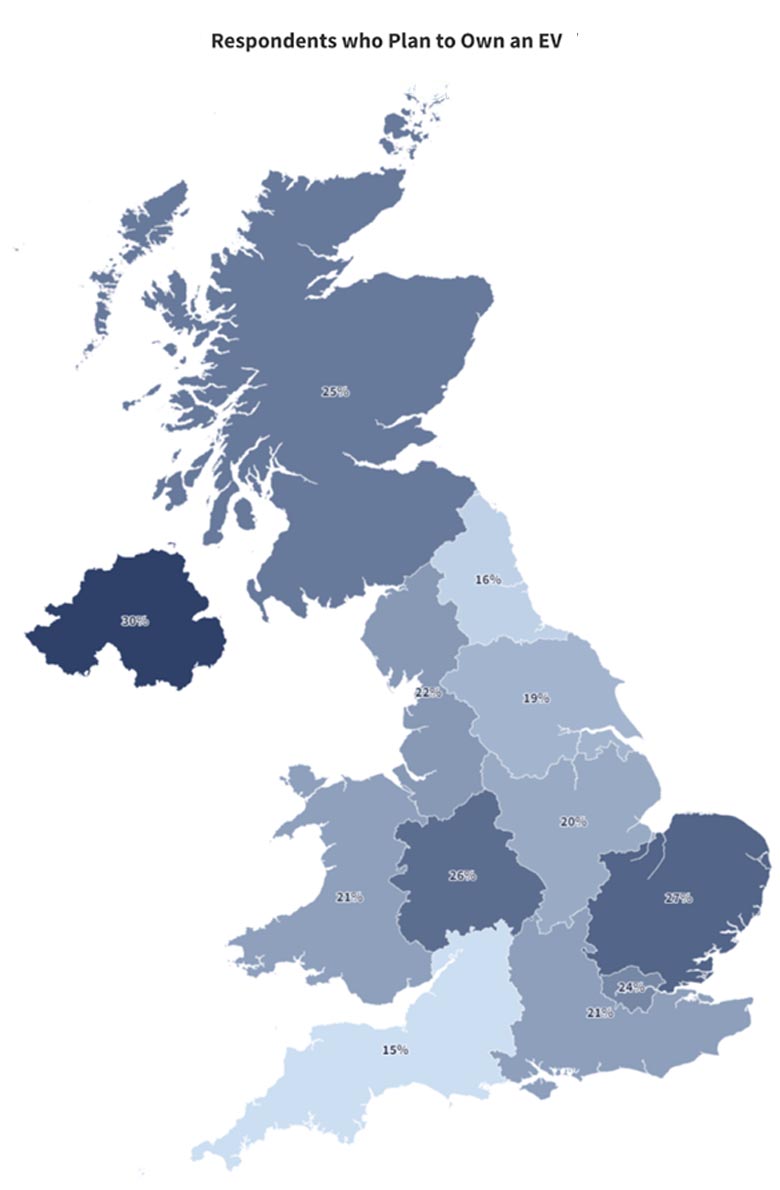
Where we live hugely affects the likelihood of us already driving an EV. In London, just over a quarter of people say they already have an EV and a further 23.58% plan to get one.
At the opposite end of the scale, ownership across the rest of the South East, across the South West, Wales, Scotland and the West Midlands sits at below 14%. So this is a huge variation in statistics.
Home EV charger installation demand
With ownership increasing and many more millions of people, based on our statistics, planning to get an EV and install a home charger, how has EV charger installation demand changed?
To find out, we took a look at the estimated number of searches for these services in Google UK.
We used kwfinder.com to get the estimated number of searches in Google UK for each month going back to July 2020 (the earliest month in which data was available) for each of the following search phrases:
- Electric car charger for home
- Home car charging point
- Electric charger installation
- EV charger installation
This is what we found:
| Month | Electric car charger for home | Home car charging point | Electric charger installation | EV charger installation |
|---|---|---|---|---|
| Jul 2020 | 8100 | 8100 | 2900 | 2900 |
| Aug 2020 | 8100 | 8100 | 2900 | 2900 |
| Sep 2020 | 9900 | 9900 | 3600 | 3600 |
| Oct 2020 | 9900 | 9900 | 3600 | 3600 |
| Nov 2020 | 14800 | 14800 | 5400 | 5400 |
| Dec 2020 | 9900 | 9900 | 4400 | 4400 |
| Jan 2021 | 12100 | 12100 | 4400 | 4400 |
| Feb 2021 | 14800 | 14800 | 5400 | 5400 |
| Mar 2021 | 14800 | 14800 | 4400 | 4400 |
| Apr 2021 | 14800 | 14800 | 3600 | 3600 |
| May 2021 | 18100 | 18100 | 3600 | 3600 |
| Jun 2021 | 14800 | 14800 | 3600 | 3600 |
| Jul 2021 | 18100 | 18100 | 4400 | 4400 |
| Aug 2021 | 18100 | 18100 | 4400 | 4400 |
| Sep 2021 | 22200 | 22200 | 5400 | 5400 |
| Oct 2021 | 22200 | 22200 | 5400 | 5400 |
| Nov 2021 | 22200 | 22200 | 6600 | 6600 |
| Dec 2021 | 14800 | 14800 | 4400 | 4400 |
| Jan 2022 | 18100 | 18100 | 8100 | 8100 |
| Feb 2022 | 18100 | 18100 | 8100 | 8100 |
| Mar 2022 | 22200 | 22200 | 9900 | 9900 |
| Apr 2022 | 14800 | 14800 | 6600 | 6600 |
| May 2022 | 14800 | 14800 | 5400 | 5400 |
| Jun 2022 | 18100 | 18100 | 6600 | 6600 |
| Jul 2022 | 14800 | 14800 | 5400 | 5400 |
| Aug 2022 | 18100 | 18100 | 6600 | 6600 |
| Sep 2022 | 14800 | 14800 | 5400 | 5400 |
| Oct 2022 | 14800 | 14800 | 4400 | 4400 |
| Nov 2022 | 14800 | 14800 | 6600 | 6600 |
| Dec 2022 | 12100 | 12100 | 4400 | 4400 |
| Jan 2023 | 14800 | 14800 | 8100 | 8100 |
| Feb 2023 | 14800 | 14800 | 8100 | 8100 |
| Mar 2023 | 18100 | 18100 | 9900 | 9900 |
| Apr 2023 | 18100 | 18100 | 8100 | 8100 |
| May 2023 | 14800 | 14800 | 8100 | 8100 |
| Jun 2023 | 12100 | 12100 | 8100 | 8100 |
| Jul 2023 | 14800 | 14800 | 9900 | 9900 |
| Aug 2023 | 12100 | 12100 | 9900 | 9900 |
| Sep 2023 | 12100 | 12100 | 9900 | 9900 |
| Oct 2023 | 14800 | 14800 | 12100 | 12100 |
| Nov 2023 | 14800 | 14800 | 12100 | 12100 |
| Dec 2023 | 9900 | 9900 | 9900 | 9900 |
| Jan 2024 | 14800 | 14800 | 14800 | 14800 |
| Feb 2024 | 18100 | 18100 | 14800 | 14800 |
| Mar 2024 | 22200 | 22200 | 18100 | 18100 |
| Apr 2024 | 22200 | 22200 | 14800 | 14800 |
| May 2024 | 22200 | 22200 | 14800 | 14800 |
| Jun 2024 | 14800 | 14800 | 14800 | 14800 |
| Jul 2024 | 18100 | 18100 | 14800 | 14800 |
| Aug 2024 | 14800 | 14800 | 14800 | 14800 |
| Sep 2024 | 12100 | 12100 | 14800 | 14800 |
| Oct 2024 | 18100 | 18100 | 14800 | 14800 |
| Nov 2024 | 18100 | 18100 | 14800 | 14800 |
| Dec 2024 | 27100 | 27100 | 14800 | 14800 |
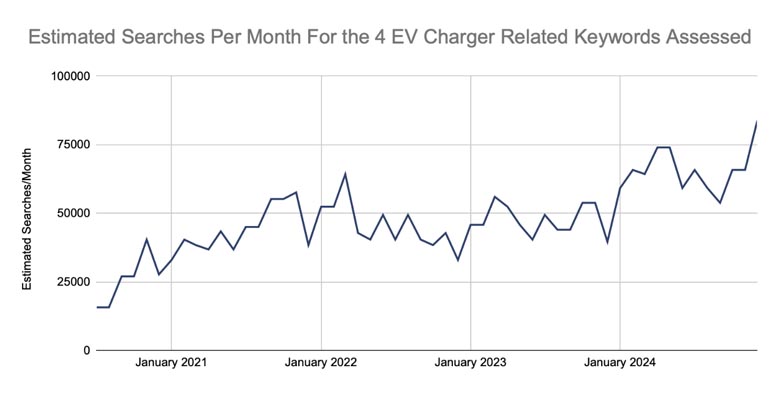
In July 2020, searches for “electric car charger for home”, amounted to around 8,100 in the UK. By July 2024, this had increased by over 120% to 18,100 before dropping slightly into Autumn in line with previous years.
The demand is increasing year on year. Across these 4 queries alone (which is only a tiny proportion of those searching for such services online), there were over 53,000 searches.
Searches for all queries peaked in December of 2024 according to the data we assessed in January 2025.
EV charger installation costs
In order to install an EV charger, you’ll need the unit itself and then the services of an electrician. Costs typically range from £800 to £1,500 depending on the specific model you go for.
Most searched for EVs
We took a list of all currently available electric vehicles in the UK from ev-database.org and then we assessed how many times in any given month (average of the last 12 months) they’re searched in Google UK.
The top 20 EVs in the UK based on search volume are displayed in the table below:
| Keyword | Average searches (last 12 months) |
|---|---|
| Tesla Model Y | 77900 |
| Tesla Model 3 | 67200 |
| Kia EV9 | 64500 |
| Porsche Taycan | 63400 |
| Porsche Macan | 51700 |
| Citroën Ami | 51600 |
| Volvo EX30 | 51200 |
| Polestar 2 | 49900 |
| Kia EV6 | 46800 |
| BYD SEAL | 41800 |
| Polestar 4 | 40000 |
| Volkswagen ID.Buzz | 34700 |
| Nissan Leaf | 32500 |
| Hyundai Ioniq 5 | 31900 |
| Nissan Ariya | 31600 |
| BMW iX | 29500 |
| Volkswagen ID.4 | 28300 |
| Tesla Model S | 26700 |
| Tesla Model X | 24600 |
| BMW i7 | 24300 |
What about electric vans – the statistics
We’ve talked about electric cars. But what about electric vans?
The SMMT reports that there were 351,834 new vans (light commercial vehicles) added to the UK’s roads in 2024, representing an increase of 3% on 2023’s total figure.
However, the EV share of vans on the road remains static at 6.3% according to the report released in January 2025.
The same report also finds that this figure remains static despite the fact that there was an increase of 20% in the size of the range of electric LCVs available to buy in the UK.
Our own analysis found that the number of searches for “electric vans” in December 2024 was 3,400 which was the same as in December 2023, but lower than December 2022’s figure of 5,400.
So in all, the light commercial vehicle market does not appear to be going electric at the same rate as cars.
EV market statistics in the UK
We’ll wrap up our EV statistics for 2024 with some key figures from the Department for Transport:
- There are over 1.2 million EVs on the roads of the UK right now
- Around 17.8% of all new car registrations in 2024 are EVs
- Looking at just September 2024, that figure rose to just over 20%
Additionally:
- The SMMT (The Society of Motor Manufacturers) estimates there are currently 700,000+ home EV chargers already installed
How does the future look for the EV?
The proportion of electric vehicles on the roads of the UK is only likely to increase, and with a notable shortfall between the number of public charge points needed and the number that already exist, owners are increasingly likely to look at home installation wherever possible. So we anticipate the installers will be rather busy in 2025 and beyond.
Methodology and caveats
We commissioned our survey through Censuswide, who operate under ESOMAR standards to ensure the data is as accurate and statistically significant as possible. On our behalf, Censuswide polled 2002 people aged 16 and over in October 2024.
It’s worth bearing in mind that Provisional Driving Licences to drive cars are only available to people aged 17 and over in the UK. So the youngest people in this survey are unlikely to be car owners at all, which will affect the responses.
For the keyword search data, we used a third party tool known as kwfinder.com which takes estimated values for various searches from Google’s own ad platform.
It’s important to bear in mind that these are estimated figures and that one search does not necessarily equate to one searcher. For example, someone could make the same search several times from a few different devices over any given month.
If you have any questions about our data or would like to see the raw survey data, please get in touch with our PR team on [email protected].